API analytics dashboard
The API analytics dashboard helps you manage your API usage by tracking your account's daily usage, trends, and top contributors. The dashboard is available to account admins on any plan with an active API usage add-on, as well as to all Enterprise accounts. The add-on can be purchased from the Admin panel or directly in the API analytics dashboard.
monday.com accounts are subject to a daily API call limit. This limit restricts the number of API calls each account can make in a given day based on its plan tier. It helps reduce the load on the API, ensuring it remains a free feature across all plans while also controlling operational costs.
How to access the dashboard
The API analytics dashboard is accessible from both the Developer Center and the Admin tab:
Developer Center
- Open the Developer Center.
- Click API analytics.
Admin tab
- Click on your profile picture in the top-right corner.
- Select Administration.
- Navigate to Usage stats in the left-side menu.
- Click API.
Dashboard widgets
The API analytics dashboard contains the widgets below. The data refreshes approximately every 10 minutes.
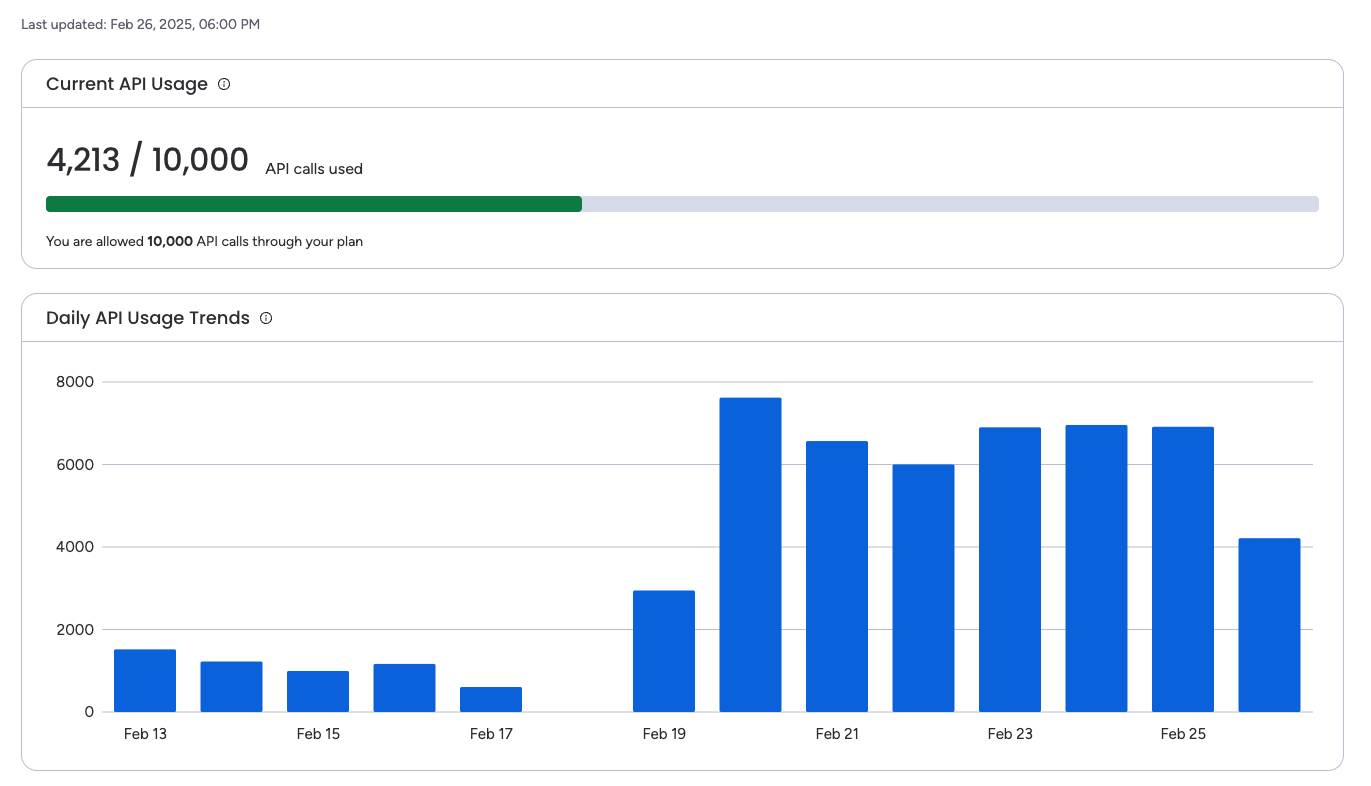
Current API usage
The Current API usage widget shows the number of calls made in a given day toward the account's daily limit. This count includes all calls made by individual users and apps. Tracking your API usage helps you understand how many calls are remaining before exceeding the limit.
Daily API usage trends
The Daily API usage trends widget tracks your account's API usage over the past 14 days. This data provides insights into consumption patterns which can help identify trends, forecast future usage, and optimize API calls accordingly.
API usage by top users
The API usage by top users widget lists the top six users who made the most API calls in the past 14 days, including calls made through applications on their behalf. This data helps identify specific users contributing to the account's API usage, ultimately helping to manage the daily call limit more effectively.
API usage by top apps
The API usage by top apps widget lists the top six applications that made the most API calls in the past 14 days. This data shows each app's relative contribution to overall API usage, ultimately helping you identify which apps are consuming the most.
Updated 17 days ago