App analytics
Learn more about your app's installations, reviews, listing page performance, usage, and payments
The Analytics section of the Developer Center compiles data about your app's installations, uninstallations, reviews, ratings, listing, usage, and payments. These insights are not accessible via the API.
Most data refreshes daily to ensure you consistently have the most up-to-date insights. You can use these metrics to make informed decisions that improve your app's performance, enhance functionality, and help you succeed in the marketplace.
Pro tip
The data in these sections currently can't be downloaded or exported. If you need a copy, reach out to our team through this form!
Analytics
The Analytics tab in the left-hand menu contains information about your app's installations, reviews, and listing page performance. The section below walks through each tab and explains the available widgets.
Every widget displays the date the data was last updated in the top-right corner. To learn more about a widget in the UI itself, just hover over the small ⓘ icon!
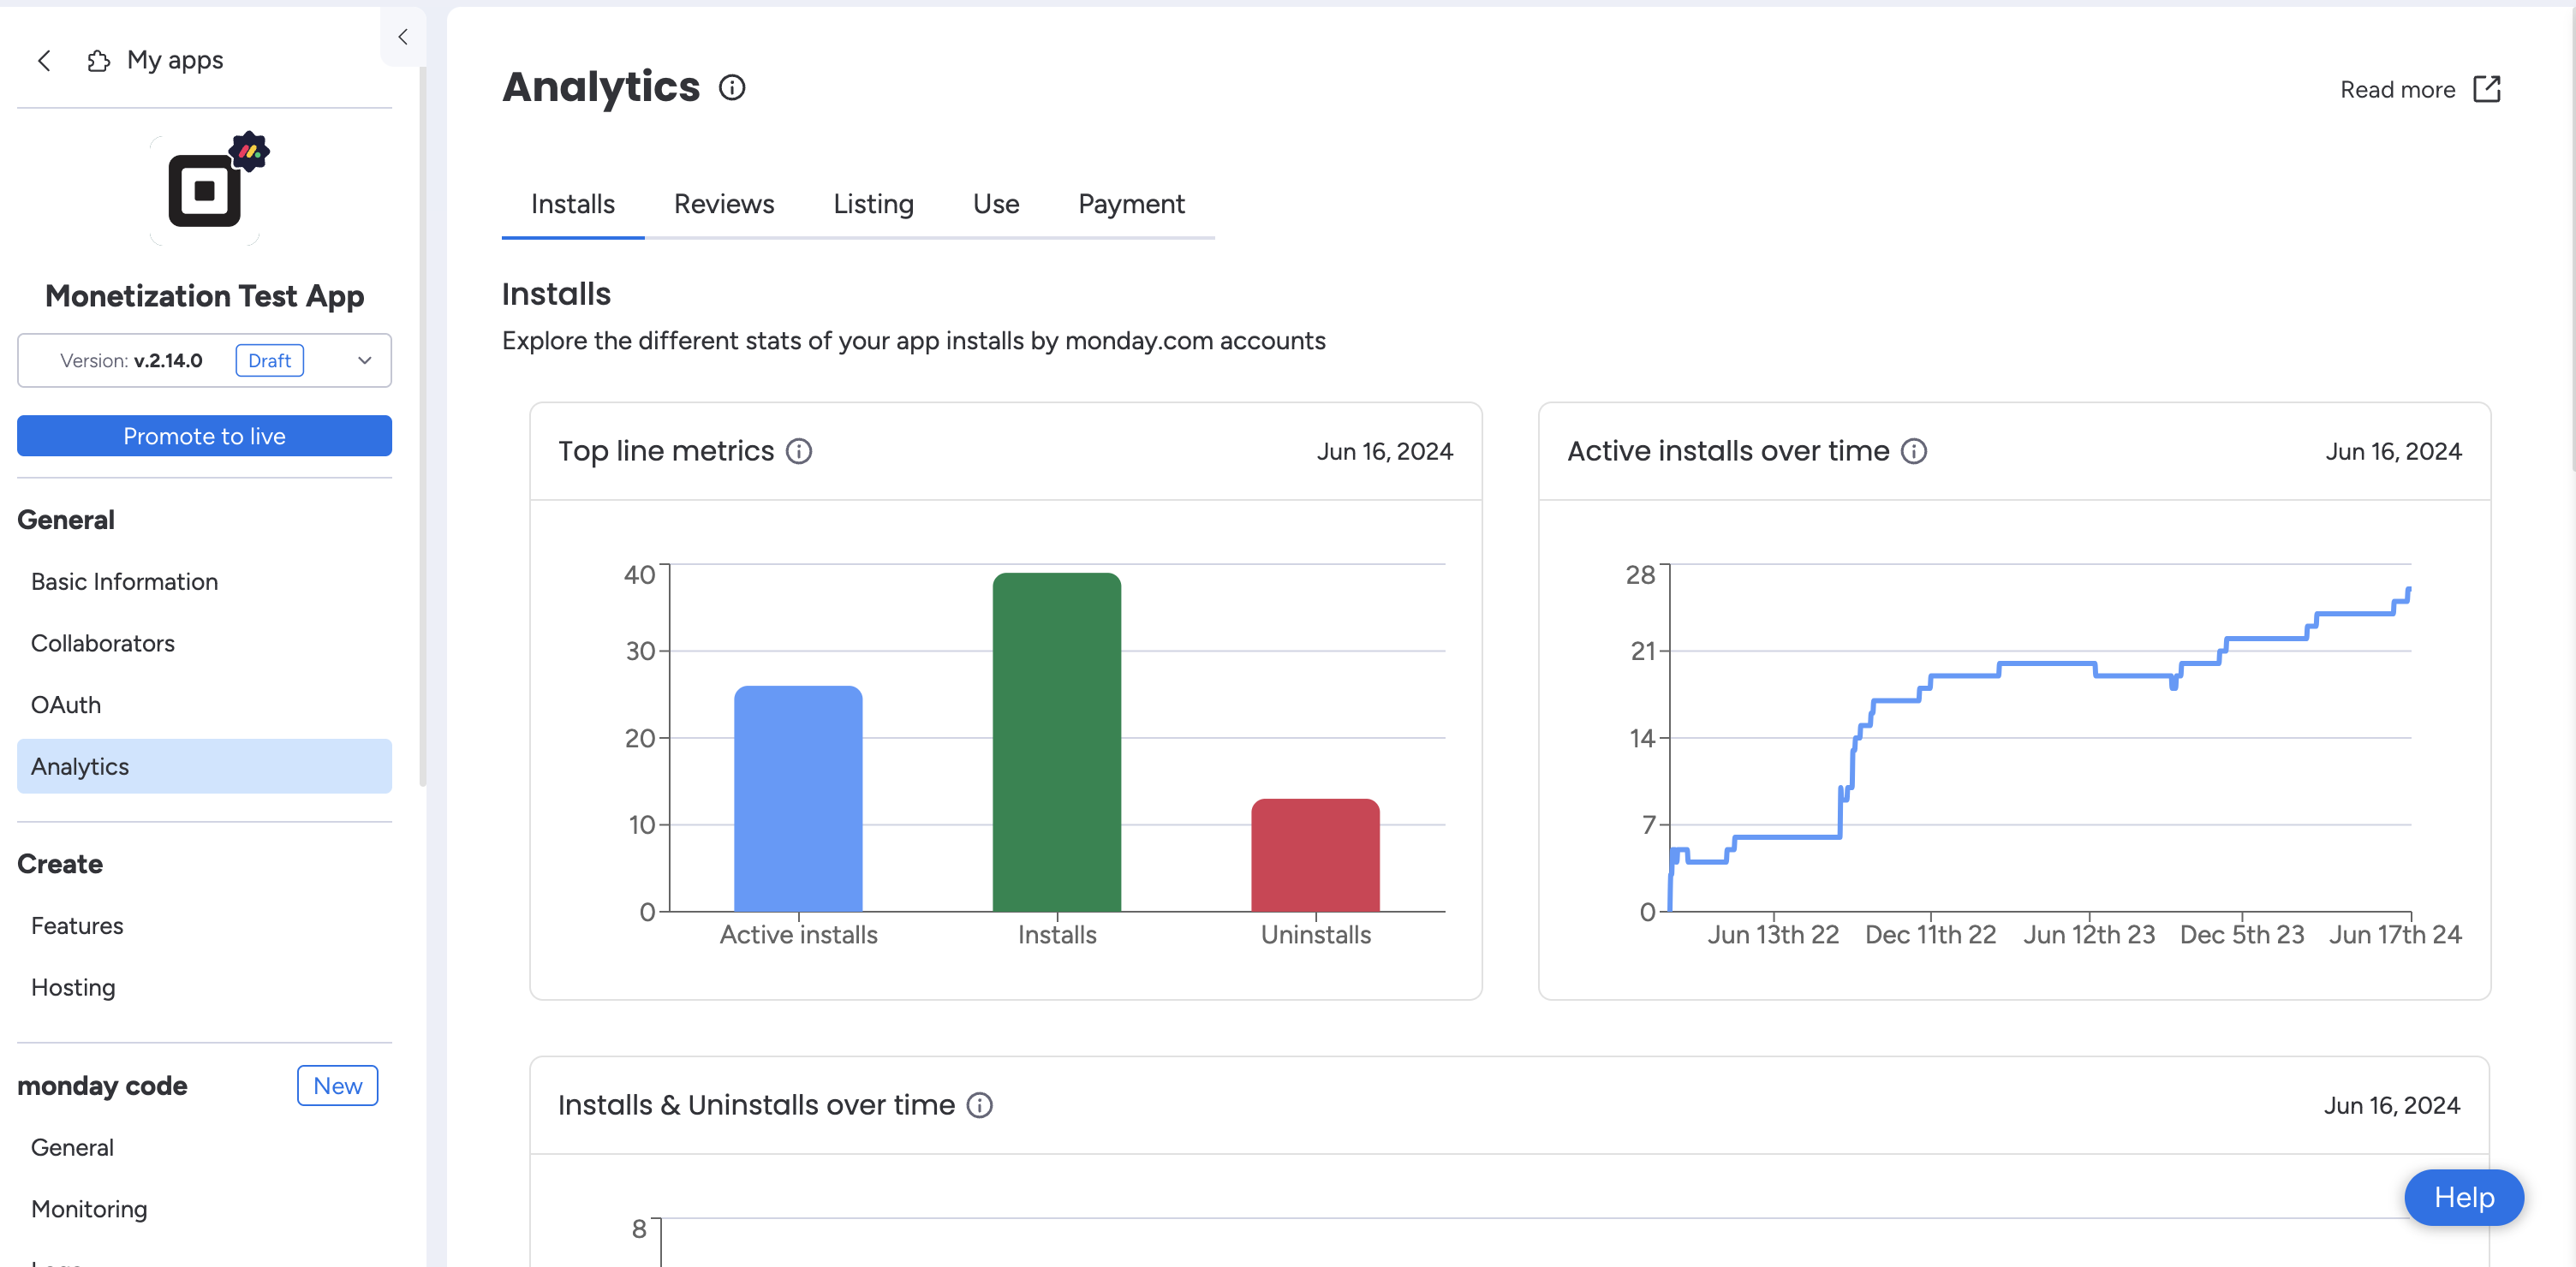
Installs tab
The Installs tab contains valuable information about your app's installations and uninstallations. You can see each active install, install, uninstall, and where and when they occurred.
Top line metrics
The top line metrics chart shows the total number of active installs, installs, and uninstalls. An active install (blue) refers to an instance when a user installed the app and never uninstalled it; an install (green) refers to an instance when a user installed the app and either kept it installed or eventually uninstalled it. An uninstall (red) refers to the total number of users that uninstalled the app.
Active installs over time
The active installs over time chart shows the number of all-time active installs. An active install refers to an instance when a user installed the app and never uninstalled it. You can hover over the timeline in the chart to see the exact day a user installed the app.
Installs and uninstalls over time
The installs and uninstalls over time chart shows the number of installations (green) and uninstallations (red) the app had on a given day. You can hover over the timeline in the chart to see the exact day an installation or uninstallation occurred.
Overall accounts installing by monday.com plan
The overall accounts installing by monday plan chart displays your app's all-time installs by the account's monday.com subscription.
Overall accounts installing by account region
The overall accounts installing by region chart displays your app's all-time installs by account region.
Installs by the account's maximal size
The installs by the account's maximal size graph shows your app's all-time installs by the account's maximum size.
Recent installs log
This information is confidential and shared under the Developer Terms.
The recent installs log displays the following details for all app installations in the past 7 days:
- the install timestamp
- account region,
- account ID
- account name
- team size (the number of estimated seats the user filled out during the signup survey)
- number of paid seats
- account tier
- payment status
Reviews tab
The Reviews tab contains your app's ratings and reviews information. Here, you can see your app's average rating over the past year and a breakdown of all individual ratings and reviews. If your app doesn't have any ratings or reviews yet, you will see the following screen.
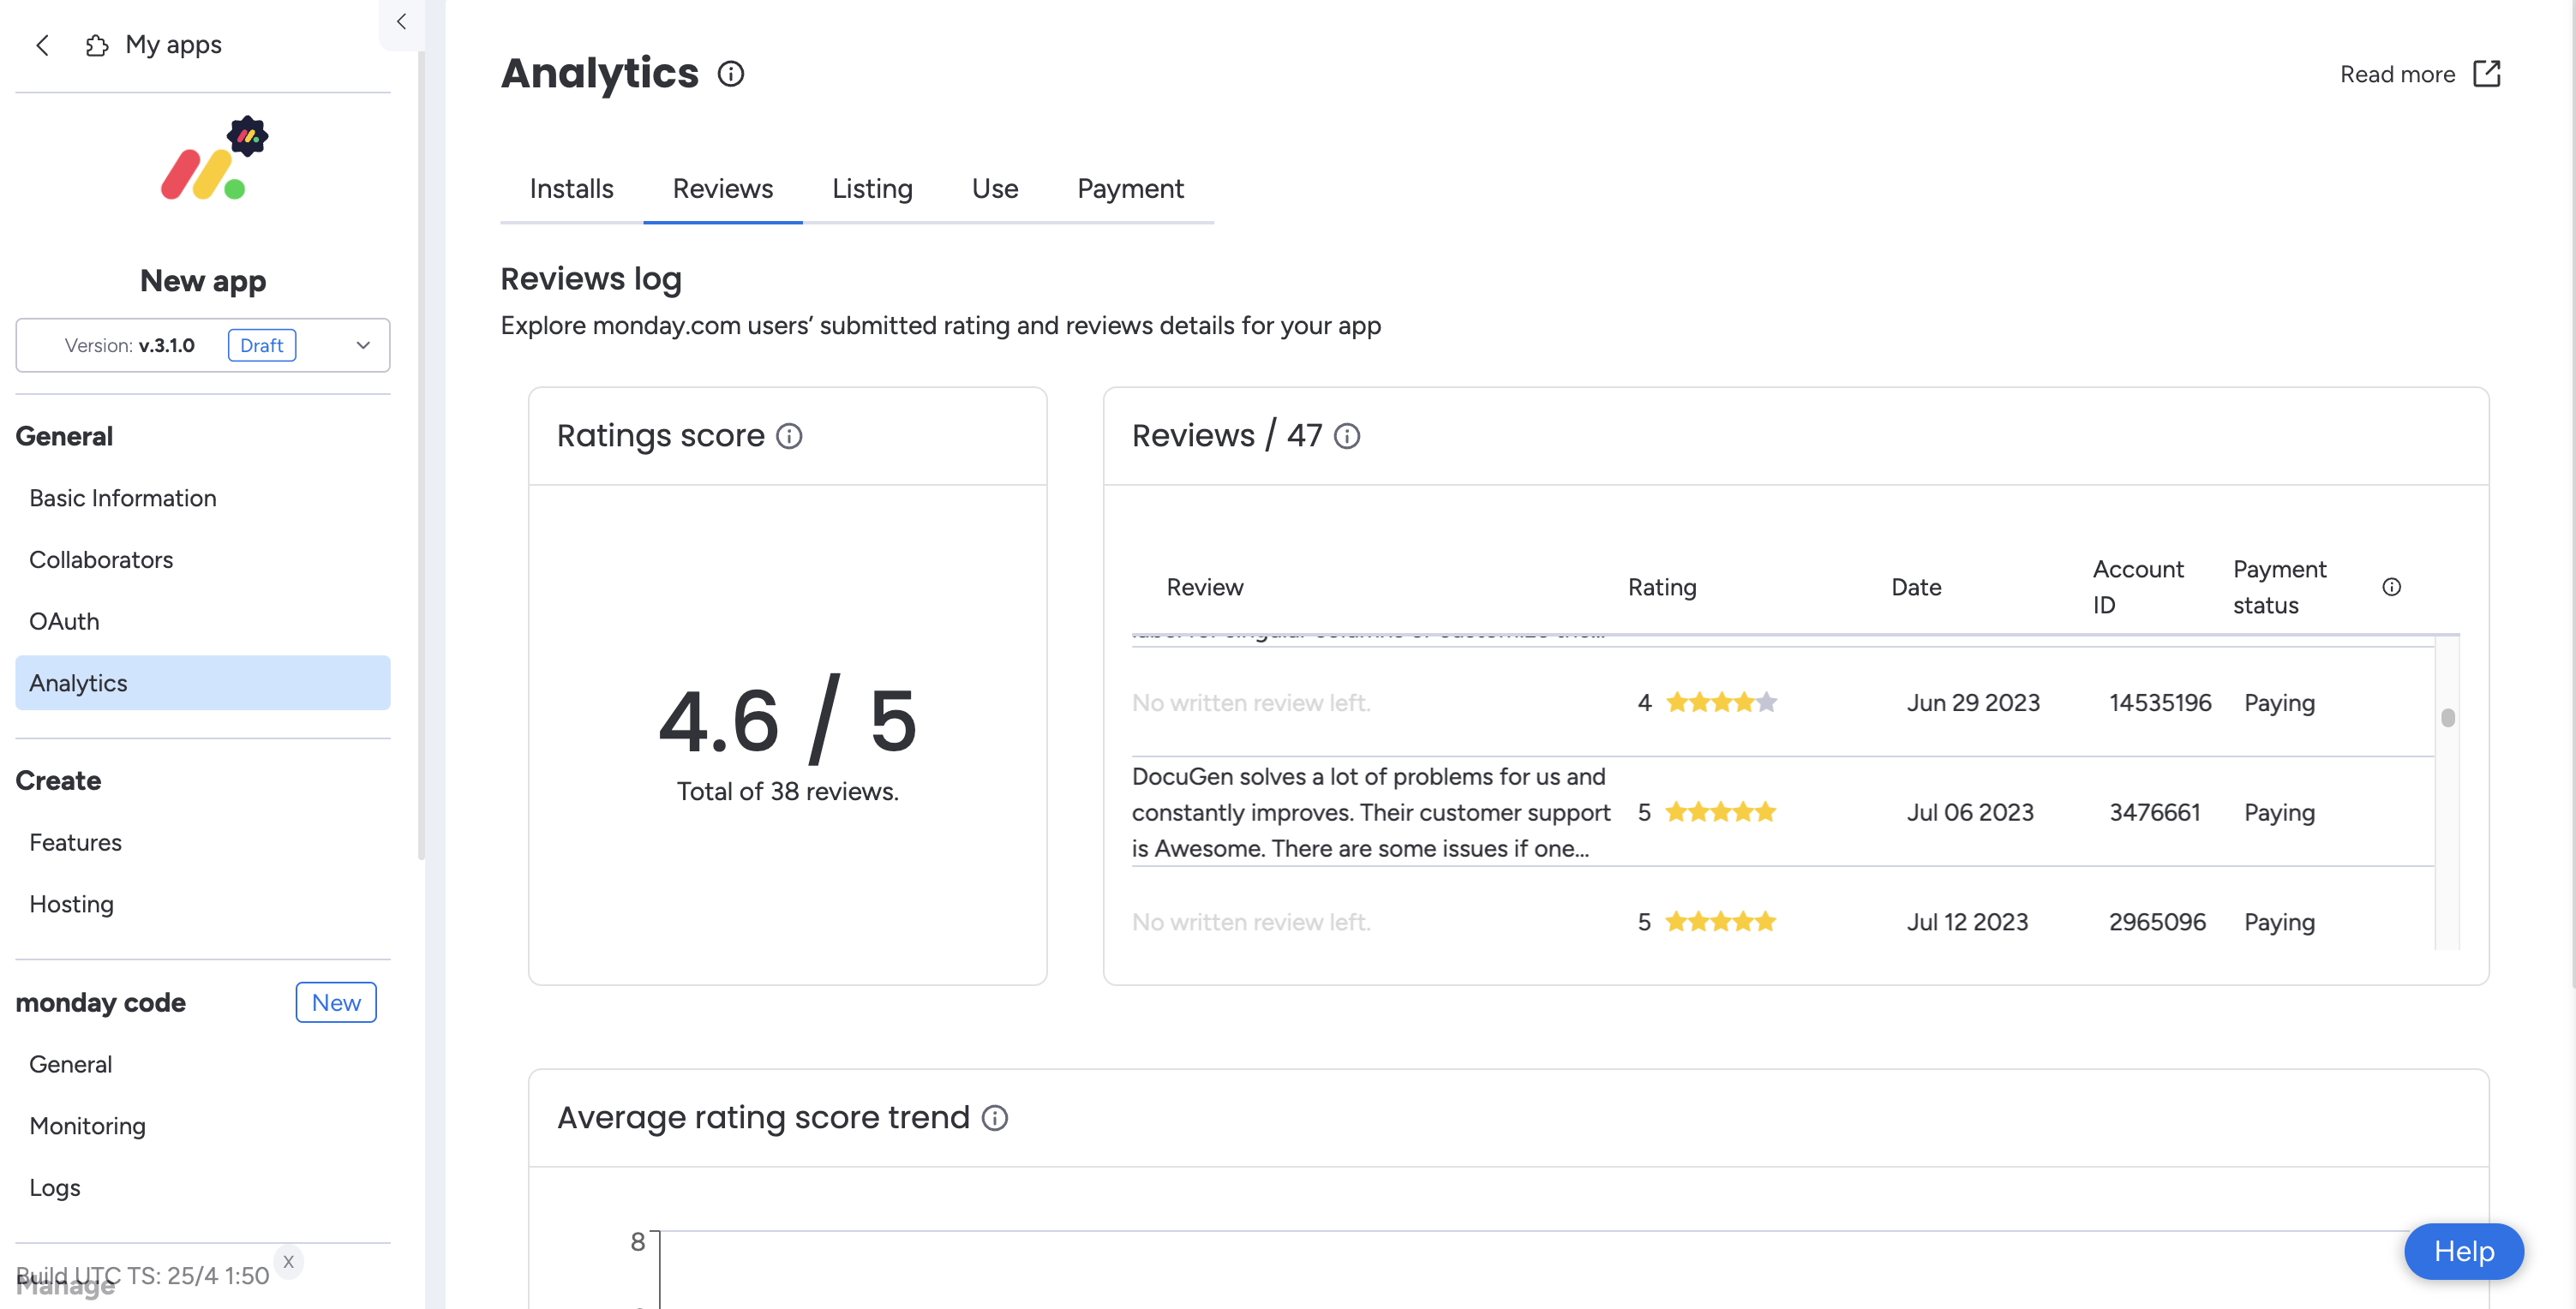
Rating score
The ratings score box shows your app's average score based on all ratings collected in the past 365 days.
For example: If your app received 9 five-star and 1 four-star reviews, the ratings score box would show an average score of 4.9 stars.
Reviews
The reviews box highlights all ratings given to your app in chronological order. This section breaks the data into four relevant columns: review, rating, date, account ID, and payment status*.
The review column contains the optional text review where users discuss what they liked or did not like about the app. This column is a helpful way to collect feedback about improving your app. The rating column shows the individual rating on a scale of 1-5 stars, and the date column displays the date the user left the review. If the user edits their review, it will still show the original post date in this column.
Since you can't access information on an individual level, the account ID column contains the account ID that each user belongs to. The payment status* column shares whether or not the account is a paying monday.com user.
*This information is confidential and shared under the Developer Terms.
Average rating score trend
The average app rating score trend widget displays your app's average rating over the past six months.
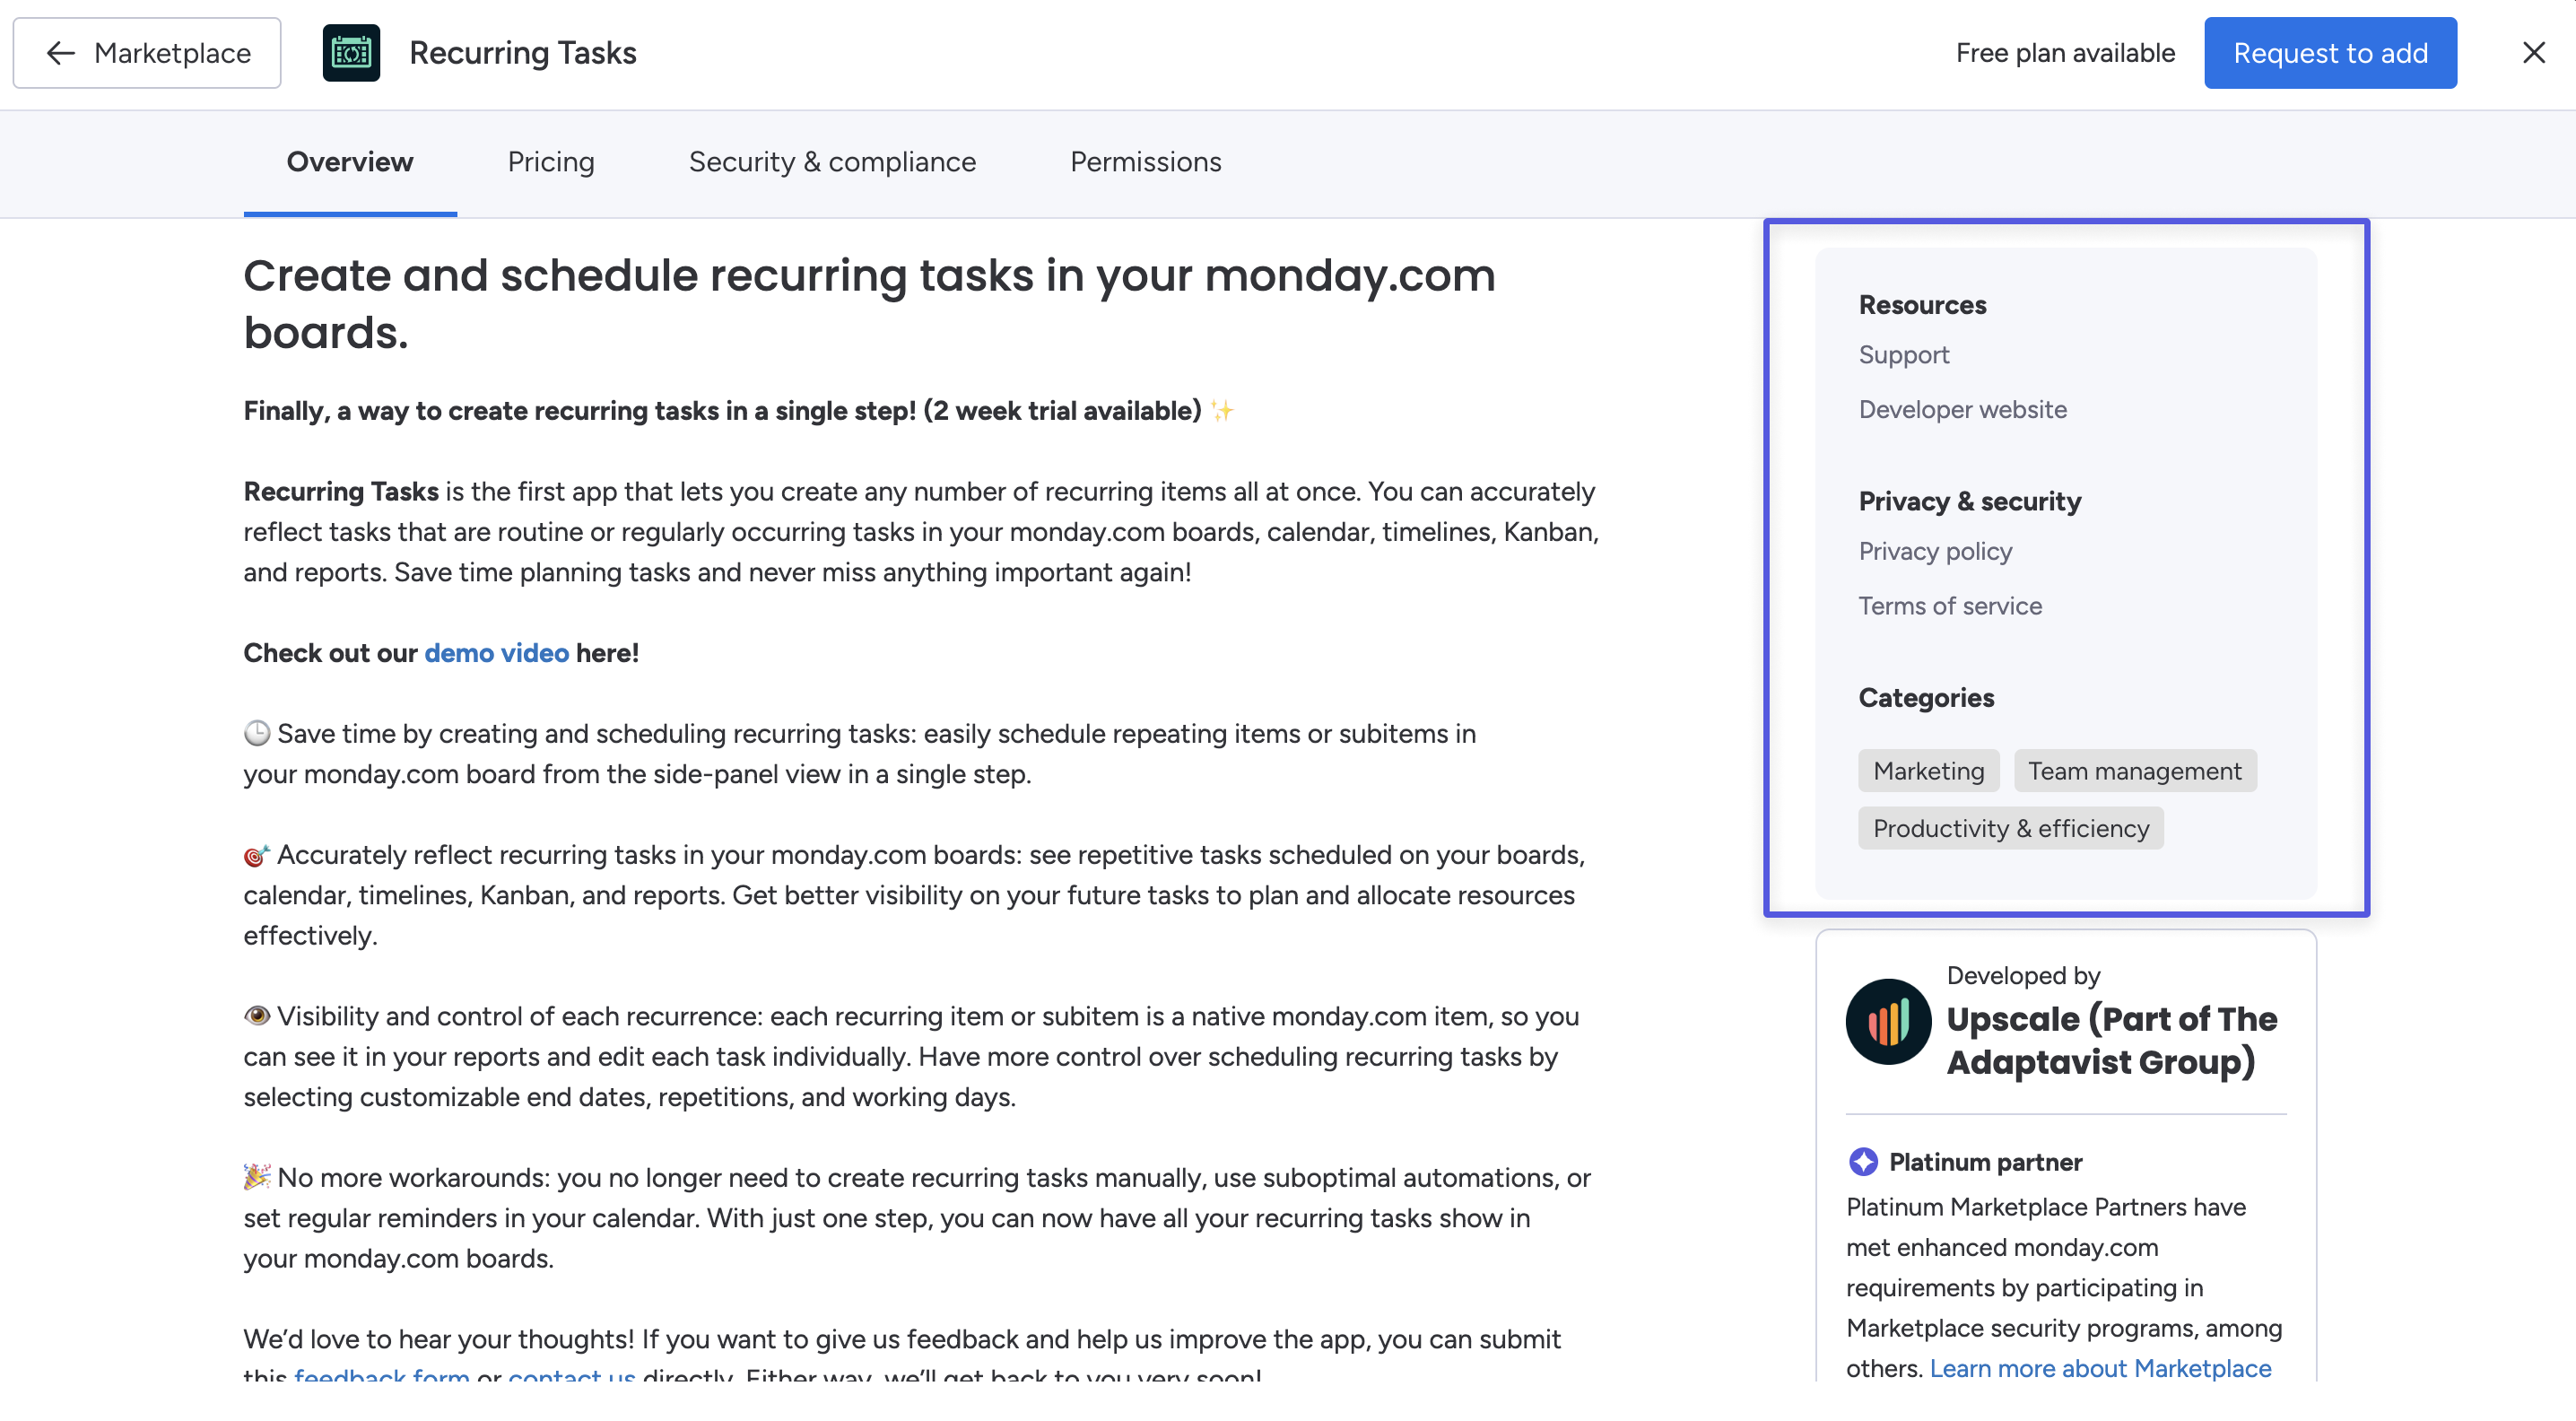
Listing tab
The listing tab contains detailed information about visits and interactions with your app's in-product marketplace listing page.
Funnel of customers from visiting the app listing page to clicking the main install CTA
The funnel of customers from visiting the app listing page to clicking the main install CTA widget shows the funnel of accounts from opening the app listing page to clicking the CTA in the past six months.
Conversion rates trend of customers from visiting the app listing page to clicking the main install CTA
The conversion rates trend of customers from visiting the app listing page to clicking the main install CTA widget shows the conversion rate of accounts from opening the app listing page to clicking the CTA in the past six months.
Users visiting the page
The users visiting the page widget displays the number of unique users who opened your app listing page in the past six months.
Users visiting the page over time
The users visiting the page over time chart shows the number of instances someone opened your app listing page in a given week in the past six months. You can hover over a specific week to see the exact number of app listing page views that occurred in that period.
Users visiting the page by source
The users visiting the page by source graph shows the top ten sources from which users opened your app listing page in the past six months.
Users visiting the page by marketplace category
The users visiting the page by marketplace category graph shows the number of users who accessed your app listing page from each menu category in the past six months.
Users visiting the page based on the search keyword on the marketplace
The users visiting the page based on the search keyword on the marketplace graph shows the top ten search words users typed before opening your app listing page in the past six months.
Trend of the top ten search keywords used by users visiting the page
The trend of the top ten search keywords used by users visiting the page graph shows the top ten search keywords in a given week from users that opened the app listing page in the past six months.
Users clicks on the developer's links
The users clicks on the developer's links graph shows the number of clicks on each category in the developer information menu. The statistics include the contact developer, developer website, privacy policy, terms of service, and pricing categories.
Use tab
Users using the app
The users using the app widget displays the number of unique users that opened, viewed, or used the app in the past 30 days.
Trend of users using the app
The trend of users using the app chart shows the week-by-week trend of unique users that opened, viewed, or used the app in the past six months.
Accounts using the app
The accounts using the app widget displays the number of unique accounts that opened, viewed, or used the app in the past 30 days.
Trend of accounts using the app
The trend of accounts using the app chart shows the week-by-week trend of unique accounts that opened, viewed, or used the app in the past six months.
Funnel of accounts from installing to using
The funnel of accounts from installing to using graph displays how many accounts installed the app vs. how many used it in the past six months.
Conversion rates trend of accounts from installing to using
The conversion rates trend of accounts from installing to using widget shows the week-by-week conversion rate of app installers to app users in the past six months.
Payment tab
Conversion from install to pay
The conversion from install to pay widget displays the rate of accounts that converted from app installers to paid subscriptions in the past six months.
Minimal days to pay
The minimal days to pay graph tracks the minimum number of days it takes after installation for an account to purchase an app subscription in the past six months.
Median days to pay
The median days to pay graph tracks the median number of days it takes after installation for an account to purchase an app subscription in the past six months.
Maximal days to pay
The maximal days to pay graph tracks the maximum number of days it takes after installation for an account to purchase an app subscription in the past six months.
Funnel of accounts from installation to purchasing
The funnel of customers from installation to purchasing graph displays how many accounts made it to each part of the installation-to-purchase funnel in the past six months.
Conversion rate trend of accounts from installation to purchasing
The conversion rate trend of customers from installation to purchase widget shows the week-by-week conversion rate of app installations to paid subscriptions in the past six months.
Join our developer community!
We've created a community specifically for our devs where you can search through previous topics to find solutions, ask new questions, hear about new features and updates, and learn tips and tricks from other devs. Come join in on the fun! 😎
Updated 2 months ago