Payment
Learn how to analyze conversion rates and timelines from installation to paid subscriptions
The Payment tab in the Developer Center tracks key metrics related to your app's monetization, including install-to-purchase funnels and conversion timelines.
These insights help you monitor conversion performance, optimize onboarding, and identify friction points throughout the subscription journey.
Hover over any ⓘ icon in the dashboard to view detailed explanations for each metric.
Widgets Overview
The Payment tab includes several widgets to track different metrics:
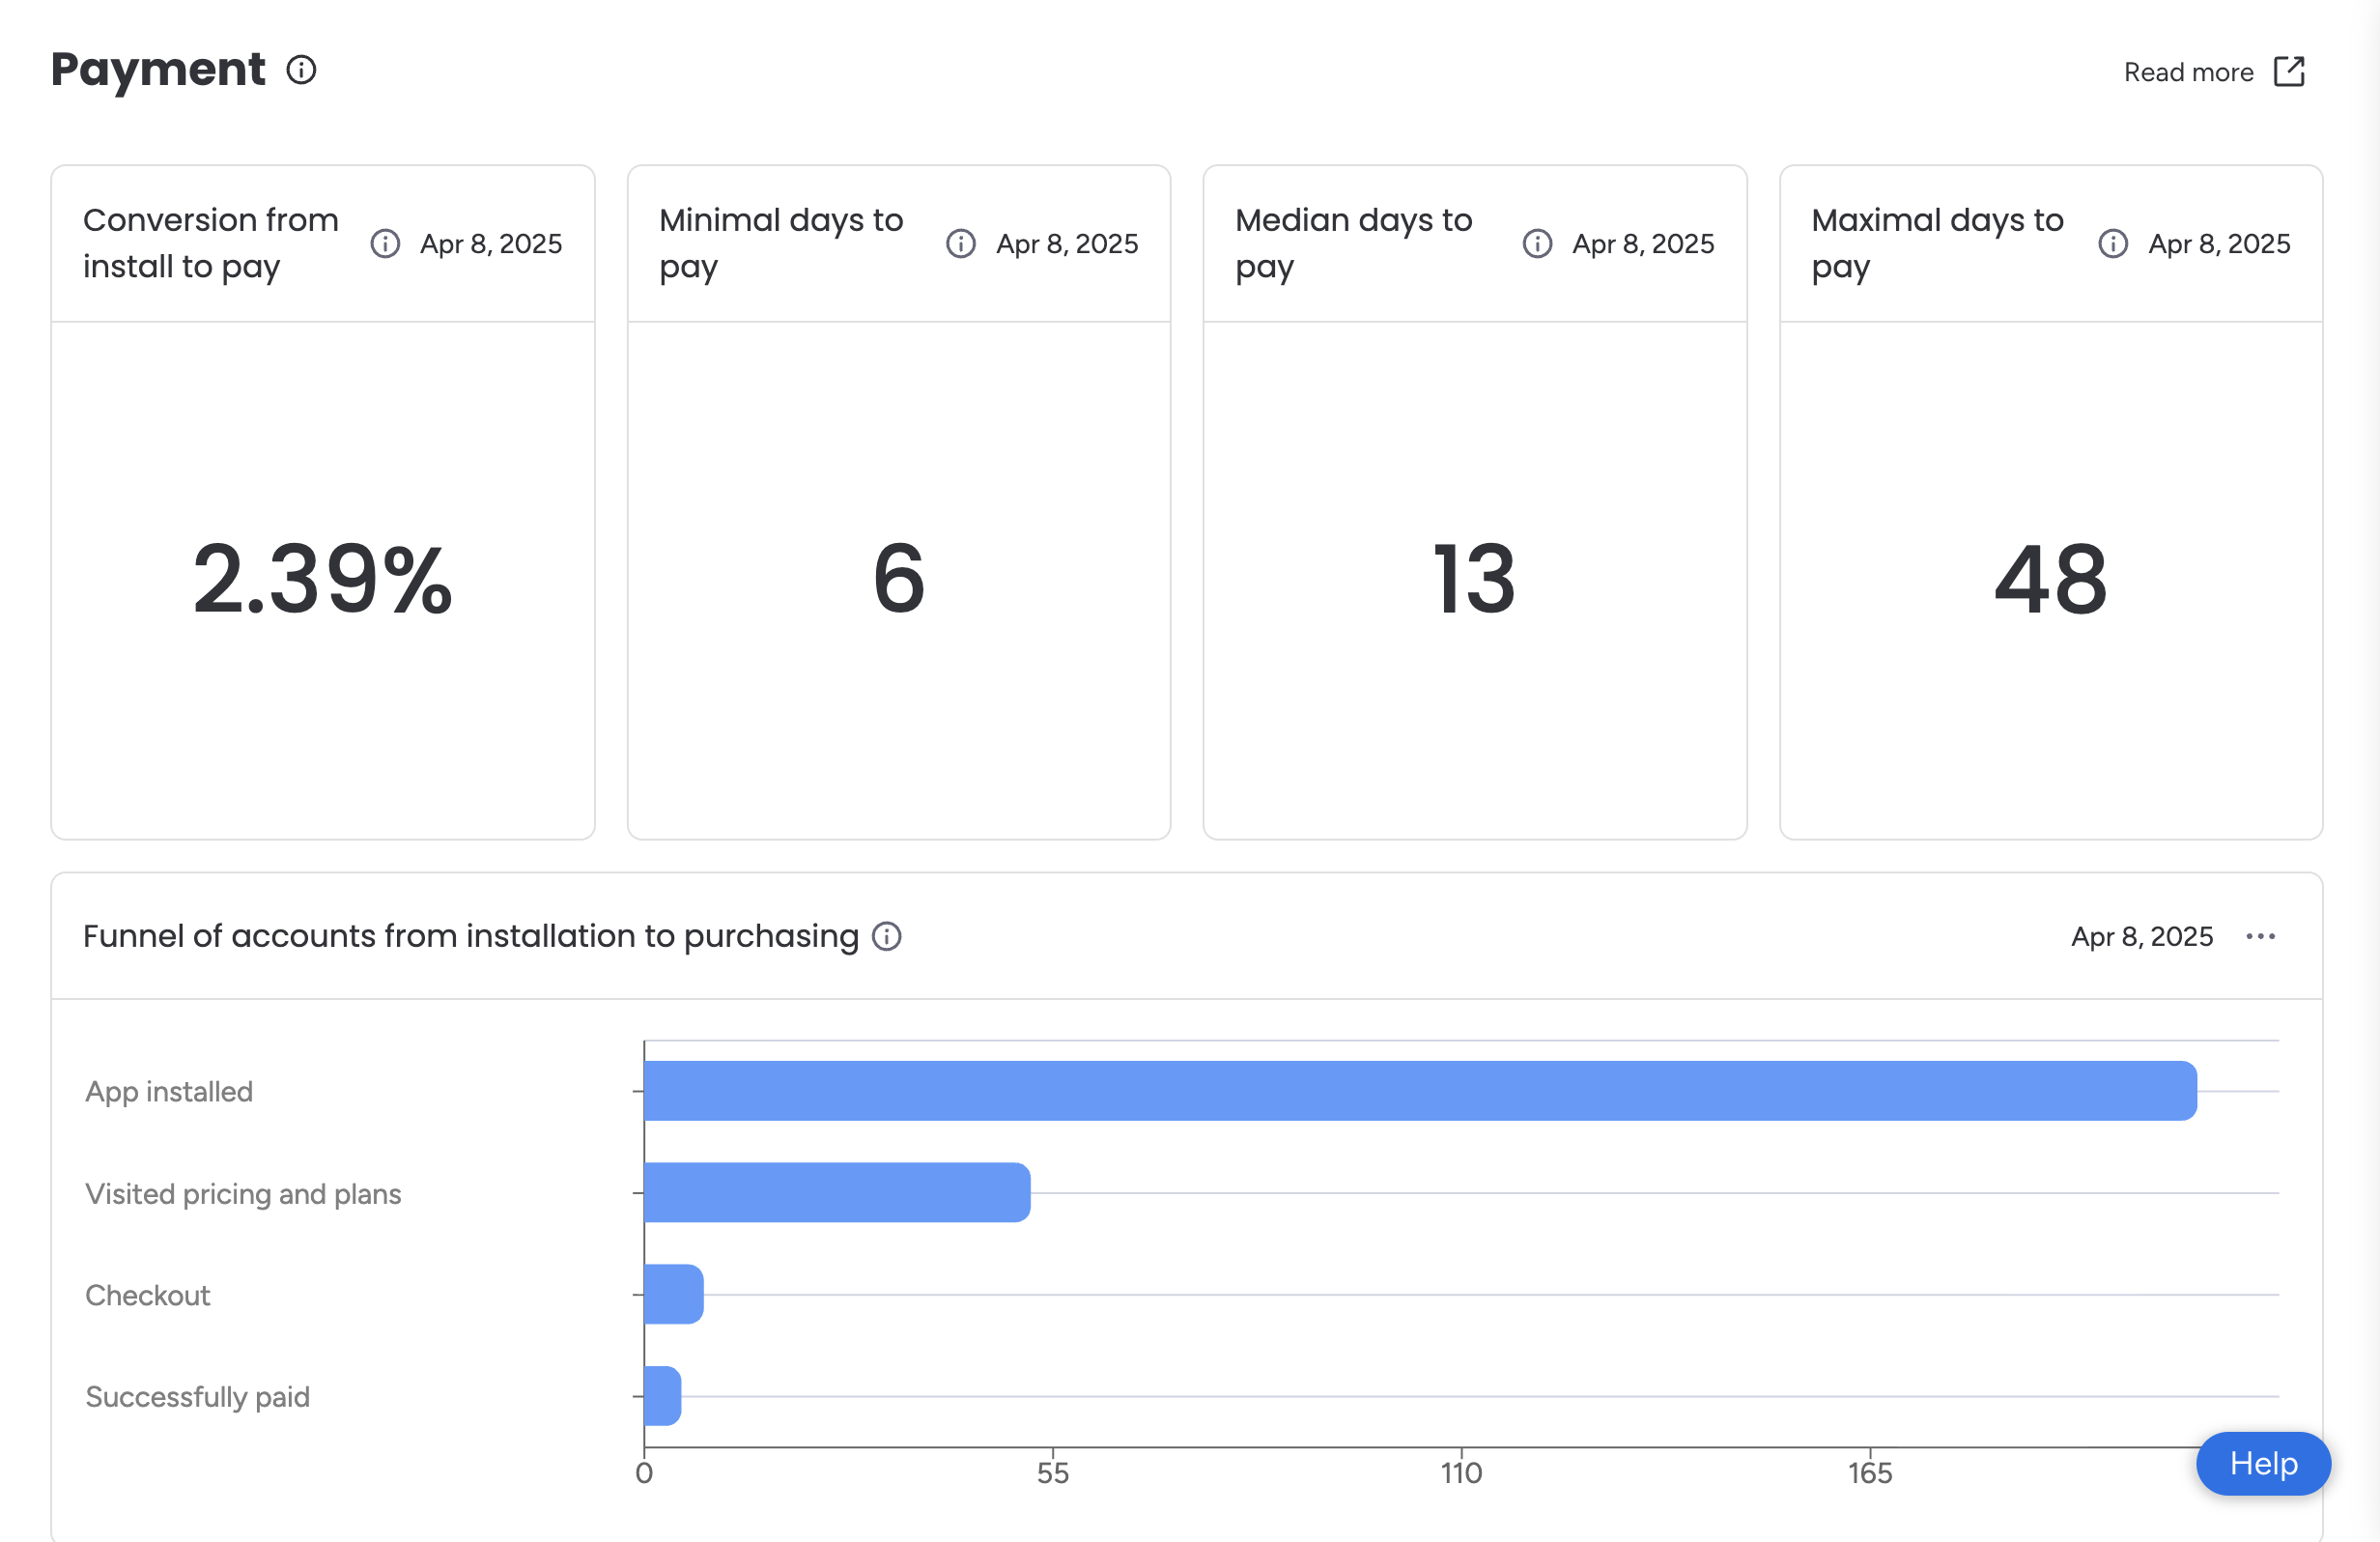
| Widget Title | Description |
|---|---|
| Conversion from install to pay | Percentage of accounts that converted from installation to a paid subscription in the past six months |
| Minimal days to pay | Shortest number of days it takes after installation for an account to purchase a subscription in the past six months |
| Median days to pay | Median number of days it takes after installation for an account to purchase a subscription in the past six months |
| Maximal days to pay | Longest number of days it takes after installation for an account to purchase a subscription in the past six months. |
| Funnel of accounts from installation to purchasing | Number of accounts progressing through each stage of the installation-to-purchase journey in the past six months |
| Conversion rate trend of accounts from installation to purchasing | Week-by-week conversion rate of app installations to paid subscriptions in the past six months |
Export the Data
You can export data from most widgets on the Payment page as a CSV file for further analysis or sharing.
To export:
- Navigate to the Payment tab.
- Click the three dots (…) in the top-right corner of the relevant widget. If you don’t see the three dots, that widget’s data isn’t available for export.
- Select Download CSV.
- Open the CSV file from your local device.
Updated 9 months ago
Did this page help you?