Usage
Learn how users and accounts engage with your app over time
The Usage tab in the Developer Center helps you track how your app is being used across accounts and users. It provides visual reports on activity, adoption trends, and conversion funnels, offering clear insights into how engagement changes over time.
By analyzing this data, you can identify periods of low usage, monitor engagement trends, and measure overall app adoption.
Hover over any ⓘ icon in the dashboard to view detailed explanations for each metric.
Widgets Overview
The Usage tab includes several widgets to track different metrics:
| Widget Title | Description |
|---|---|
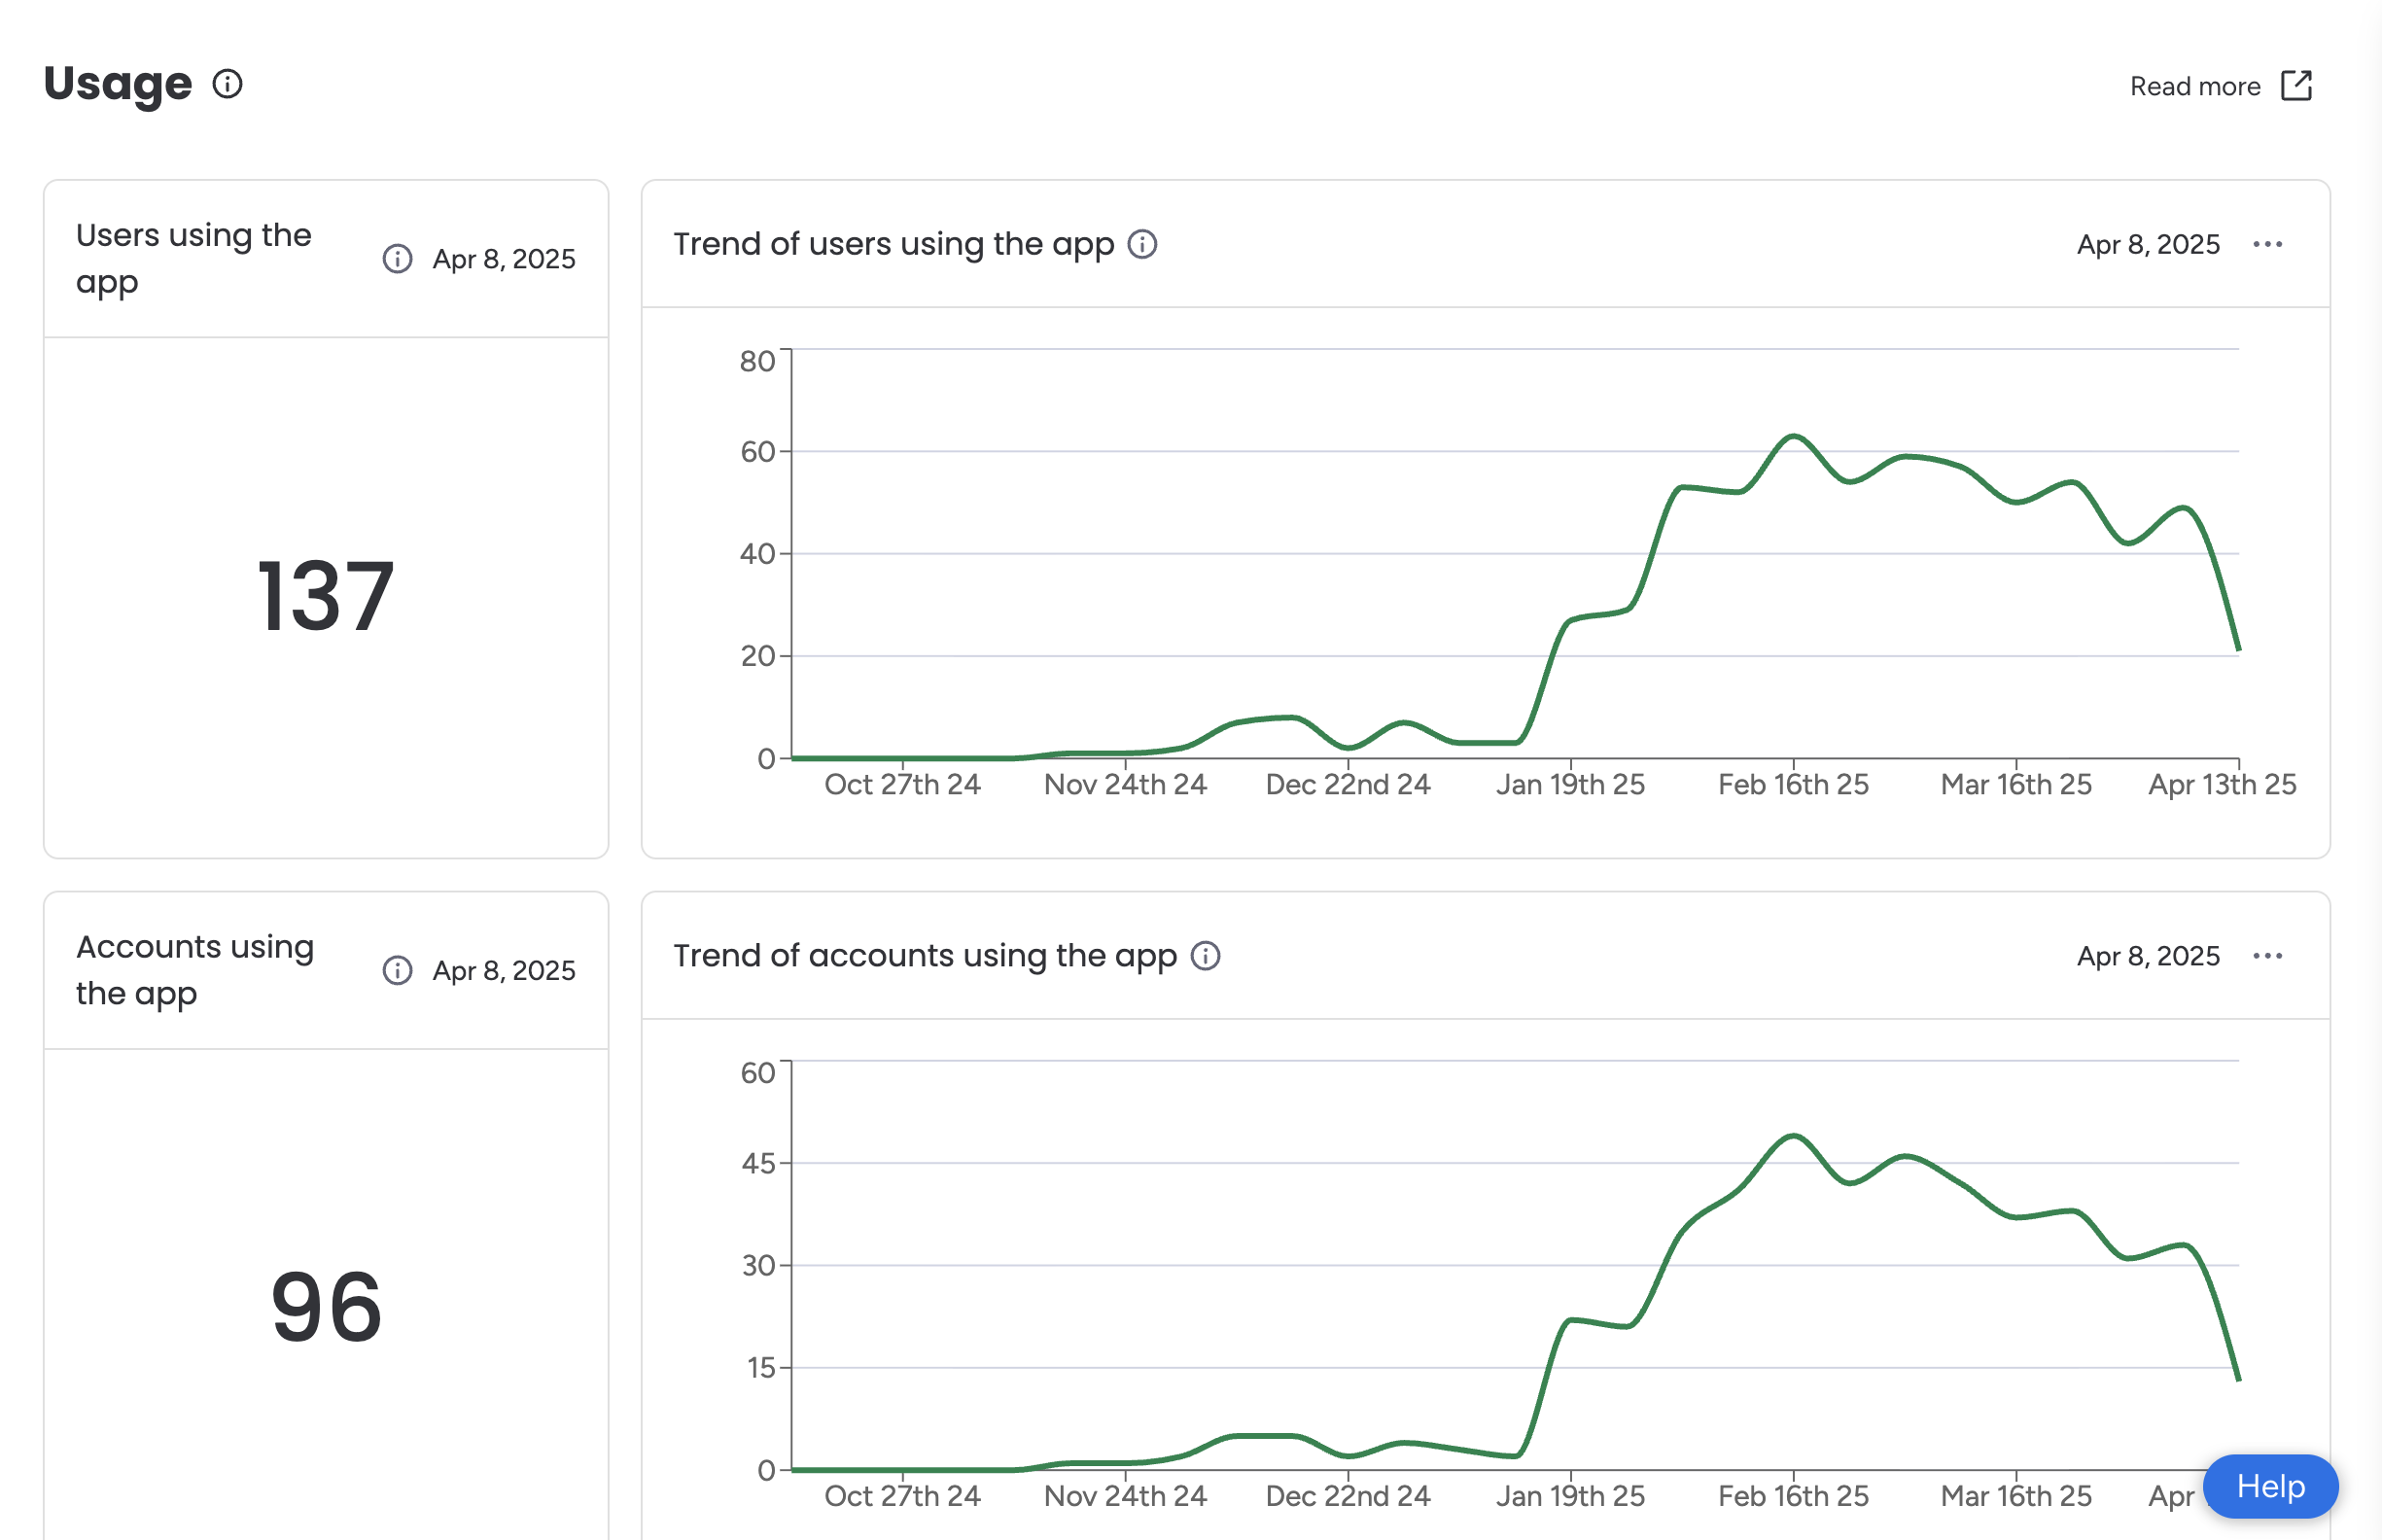
| Users using the app | Number of unique users who opened, viewed, or interacted the app in the past 30 days |
| Trend of users using the app | Week-by-week trend showing how many unique users opened, viewed, or interacted with the app over the past six months |
| Accounts using the app | Number of unique accounts where at least one user opened, viewed, or interacted with the app in the past 30 days |
| Trend of accounts using the app | Week-by-week trend showing how many unique accounts opened, viewed, or interacted with the app over the past six months |
| Funnel of accounts from installing to using | Number of accounts that installed the app compared to those that actively used it in the past six months |
| Conversion rates trend of accounts from installing to using | Week-by-week conversion rate showing how many installing accounts actively used the app over the past six months |
Export the Data
You can export data from most widgets on the Usage page as a CSV file for further analysis or sharing.
To export:
- Navigate to the Usage tab.
- Click the three dots (…) in the top-right corner of the relevant widget. If you don’t see the three dots, that widget’s data isn’t available for export.
- Select Download CSV.
- Open the CSV file from your local device.
Updated 8 months ago
Did this page help you?