Monitor your app with monday code alerts
monday code alerts help you proactively monitor backend applications and catch issues before they affect end-users. In just a few steps, you can configure alerts and view them in a centralized monday.com board with context, timestamps, and regional insights.
Using this board, you can build workflows that notify the right people, assign ownership, and integrate with your tools. Doing so helps keep your app running smoothly and ensures more effective incident response.
monday code alerts provide you with:
- Early warnings for performance issues and runtime limit breaches
- An auto-generated centralized alert board with timestamps and regional insights
- Native integrations to trigger Slack notifications, assign alerts, or integrate with external tools
- Developer-friendly technical context with actionable data
Types of alerts
monday code currently supports three types of alerts:
| Alert Type | What It Monitors | Use Cases |
|---|---|---|
| HTTP error rate | Percentage of HTTP requests that return error status codes (e.g., 4xx, 5xx) within a specific window | • Detect sudden spikes in errors • Monitor API endpoint reliability • Track overall app health |
| HTTP latency response | Percentage of response times that exceed your latency threshold | • Monitor the impact of code changes • Ensure SLA compliance • Catch performance degradation early |
| Runtime limit | Daily runtime execution limit quota | • Prevent service blocking • Monitor resource consumption trends • Plan capacity for high-traffic periods |
How to set up alerts
Create an alert
- Open your app in the Developer Center.
- Navigate to Host on monday.
- Click Server-side code.
- Select the Alert policies tab.
- Click Create alert.
Configure an alert
- If you don't have an alert board set up, select a workspace to create one in.
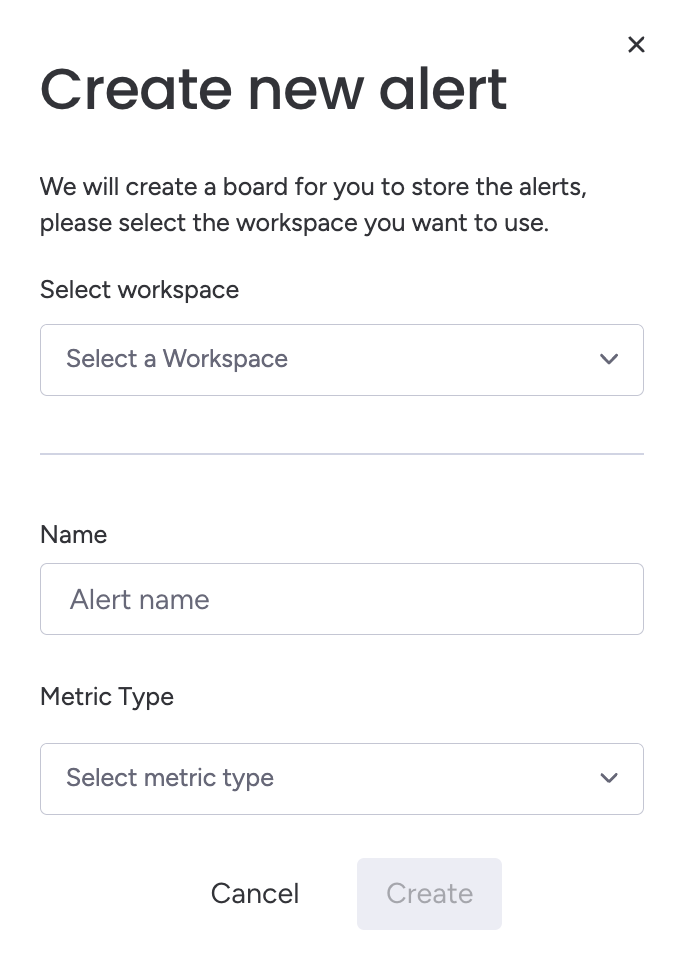
- Enter a descriptive name.
- Select the alert type from the Metric Type dropdown.
- Configure the parameters:
| Alert Type | Description | Suggested Configuration |
|---|---|---|
| HTTP error rate | • Threshold above (%): Error rate percentage (e.g., 5% means 5 out of 100 requests are errors) • Time window (minutes): The evaluation period | • Threshold above (%): 1-5% • Time window (minutes): 10-15 minutes |
| HTTP latency response | • Threshold above (ms): Maximum acceptable response time • Percentile: What percentile of requests can exceed the threshold • Time window (minutes): The evaluation period | • Threshold above (ms): 2000-5000ms • Percentile: 95% • Time window (minutes): 10 minutes |
| Runtime limit | • Threshold above (%): Percentage of your daily runtime execution quota consumed • This limit is based on your app type and seat count. Read the documentation to learn how to calculate your limit. | • Threshold above: 80% of daily runtime |
Maintain alerts
- Turn alerts on/off: Use the Active toggle.
- Edit existing alerts: Click on the alert, make the changes, and click Save.
- Delete an alert: Click on the alert, select Delete.
Best practices
Responding to alerts
- Acknowledge the alert quickly and update its status to indicate that you're investigating
- Document your findings in the update section of your alert board
- Identify the root cause of the issue to understand why the alert happened
- Update runbooks to record solutions for the next time
- Adjust alert sensitivity based on false positive patterns
Tuning thresholds
We recommend starting with higher thresholds to reduce noise. You can monitor for 1-2 weeks to establish a baseline and gradually lower them as you identify normal patterns. Be sure to make seasonal adjustments based on business cycles and traffic patterns.
Investigation strategies
We recommend using the 80/20 approach to focus on the common sources first.
| Alert Type | First Steps | Common Sources | Next Steps |
|---|---|---|---|
| HTTP error rate | Check the alert board for timing and regional patterns | • Recent deployments • DB bottlenecks • Third-party APIs | Review Developer Center logs for error details |
| HTTP latency | Identify affected endpoints using the Developer Center monitoring | • Slow queries • Third-party service slowdowns | • Review recent code changes • Optimize queries |
| Runtime limit | Review app usage in the Developer Center analytics | • Runaway processes or infinite loops • High-consumption endpoints | • Optimize with caching/queries • Create scaling strategy |
Updated 9 months ago